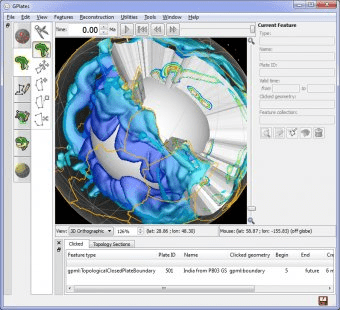
GPlates is desktop software for the interactive visualisation of plate-tectonics. GPlates offers a novel combination of interactive plate-tectonic reconstructions, geographic information system (GIS) functionality and raster data visualisation.
GPlates enables both the visualisation and the manipulation of plate-tectonic reconstructions and associated data through geological time. GPlates runs on Windows, Linux and MacOS X.
Main features:
- loading and saving geological, geographic and tectonic feature data:
- loading feature data from the following formats:
- GPML / compressed GPML
- Plates4 line-format
-ESRI Shapefile (including the ability to map shape attributes in a Shapefile to feature properties in GPlates on a user-specified, per-Shapefile basis)
-GMAP VGP (Virtual Geomagnetic Pole) data files.
- saving feature data in the following formats:
-GPML / compressed GPML
-Plates4 line-format
-ESRI Shapefile
-GMT “xy” format, with a variety of options for headers
- recording and restoring previous sessions of files opened by the user
- cookie-cutting and assigning plate IDs to loaded data using plate polygons
- loading and saving reconstruction poles (finite rotations which enable geological, geographic and tectonic features to be reconstructed through geological time):
- loading reconstruction poles from the following formats:
-GPML / compressed GPML
-Plates4 rotation-format
- saving reconstruction poles in the following formats:
-GPML / compressed GPML
-Plates4 rotation-format
- displaying raster images:
- loading multiple raster images in JPEG and NetCDF format, including time-sequences of raster images, to enable visualisation of “gridded” geophysical data such as mantle density anomalies, mantle convection-driven dynamic surface topography and the crustal age or spreading rate of the ocean floor — both:
-global raster images, which are assumed to cover the whole globe, from -180 to 180 degrees longitude and -90 to 90 latitude, and
-smaller rasters with a user-specified surface extent
- cookie-cutting raster images using static plate polygons.
- reconstructing raster images along with vector data.
- viewing feature data and raster images in a graphical display:
- displaying geological, geographic and tectonic features, as well as raster images, on the globe, in any of the following map-projections:
-3-D Orthographic Globe
-Rectangular
-Mercator
-Mollweide
-Robinson
- moving and re-orienting the camera (the viewpoint of the user), by “dragging” the mouse on the globe, using the keyboard arrow keys, or specifying the desired viewpoint in a dialog box
- activating a full-screen presentation mode, by pressing F11 to switch to a minimalist interface ideal for demonstrating data and animations on digital projectors
- zooming the camera, using the scroll-wheel of the mouse, the Zoom In tool, or the slider on the right-hand-side of the reconstruction view
- choosing different colouring schemes for vector features and for NetCDF gridded data
- exporting a 2-D geometry snapshot of the current projected contents of the reconstruction view in Scalable Vector Graphics (SVG) format, for later viewing in a web-browser or vector-graphics editor such as Adobe Illustrator
- annotating the view with text including the current reconstruction time
- managing loaded data as a series of layers allowing fine control over feature visibility
- calculating and displaying plate-tectonic reconstructions:
- reconstructing features to a desired geological time-instant, or animating over a period of geological time
- exporting “reconstructed geometries” (feature geometries at a particular reconstruction time in the past) in the following formats:


Comments (1)